Oasys checks the record for number preference, to detect rounding to the nearest 50 or 25. If
either of these are detected Oasys will display a message. This is not
100% perfect and requires human decision making. Oasys displays
number preference graphs to help with this (see below).
On mechanical
meters the peak flow is usually recorded to the nearest 10 (5
50, 5
60, 5
70
etc). In this case the number preference of the tens digit is most
useful (5, 6 and 7 in earlier numbers). Electronic meters that are
downloaded cannot have any problems with made up readings, however hand
written records from electronic meters still can. Since most electronic
meters record peak flow to the nearest 1 L/Min (55
3, 56
7, 57
1) the ones digit is the most useful (3 , 7 and 1 in the earlier numbers).
Oasys shows two graphs, one for the ones number preference and one for the tens. The y axis is the percentage of readings and the x axis is the digit.
Rounding to the nearest 50
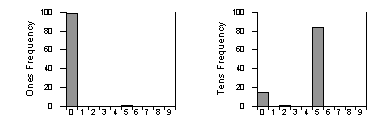
These graphs show a patient rounding to the nearest 50. The tens digit is about 80% five, 18% zero and about 2% two. Thus all the readings in the record end in either fifty-something (80%) zero-something (20%) or twenty-something (2%). Thus the patient is rounding to the nearest 50 nearly all the time. The ones digit frequency is nearly always zero, but does have a very small number of fives. Coupled with the tens digit frequency this tells us that the majority of the readings in the record end in fifty (50) or zero-zero (00). Because they are occasional twenty-somethings and some readings ending in 5 there are also probably a small number of readings that end in twenty five (25), indicating that the patient occasionally rounded to the nearest 25 instead of the nearest 50.

Rounding to the nearest 25
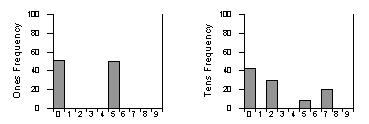
These graphs show a patient rounding to the nearest 25. In the same way as before we can tell that all the readings end in a zero or a five (the graph on the left). We can also tell that all the readings end in zero-something, twenty-something, fifty-something or seventy-something. Putting this together we can say that the patient is rounding to the nearest 25.

Evidence of made up readings
These graphs probably show evidence of made up readings. There are big spikes in the zero and five digit, which suggests that the patient put in a number ending in fifty (50) or zero-zero (00) when making up readings. If these were actual readings, it is very likely that the number preference would be more evenly distributed, or show a "hill" effect (more later).

Normal number preference
The graph below is probably normal number preference for a patient with low variability (showing a "hill" effect). The majority of the readings end in fifty-something (350 in this case), The patient's peak flow does not vary much so the next most common readings end in forty-something or sixty-something (340 and 360 in this case). She does have higher and lower blows but these are rare. Note that the hill effect can also "wrap around" from zero to nine.

The graph below is probably normal number preference for a patient with high variability. The tens number preference is roughly equal for all the digits. This patient's peak flow commonly varies by 100 L/Min or more so there is no hill effect.

Comments
Please sign in or register to add your thoughts.