The Daily Max, Min and Mean Graph |
|
Click on the "Daily" tab of the Oasys report to access the Daily Max, Min and Mean graph.
Some of the discussion on this page talks about
Pseudo Day Interpretation. You can just ignore this, but click the link if you want to know more.
Diurnal Variation
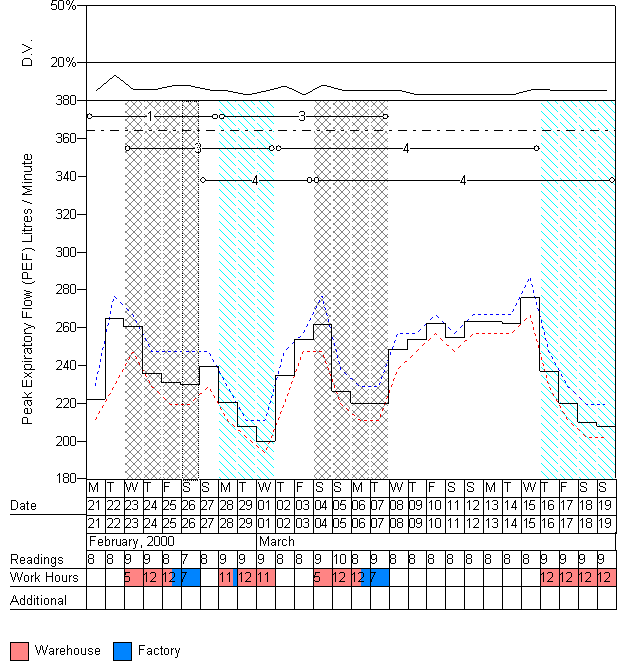
The "Daily" graph is in fact two graphs one on top of the other. The top graph is a graph of diurnal variation. The y axis is labelled "D.V." and shows the diurnal variation as a percentage. A line is drawn at 20% which a lot of people think is significant. We don't attach a lot of / any importance to diurnal variation when diagnosing occupational asthma. If the line is solid then the diurnal variation is calculated as (Maximum PEF for day - Minimum PEF for day) / Predicted Peak flow. If there is no predicted peak flow available then the line is dashed and the diurnal variation is calculated as (Maximum PEF for day - Minimum PEF for day) / Mean peak flow for entire record. The legend at the right of the graph also shows which is being displayed.
Daily Max, Min Mean
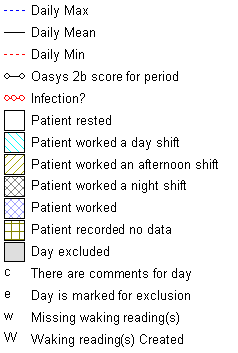
The bottom / main part of the graph shows the Maximum, Minimum and Mean PEF for each day. The blue dotted line is the maximum, the black solid "stepped" line is the mean and the red dotted line is the minimum. A dash dot dash horizontal black line shows the predicted peak flow, if it is available. Solid black horizontal lines, with small circles at each end and a number in the middle show the Oasys score for each complex, between 1 and 4 (1=no work effect, 4= a definite work effect). These are aggregated to produce the overall Oasys score (with weighting for the ones and fours) which is shown on the
Conclusions page of the report. The Oasys score is reasonably tolerant of missed or mistimed readings. It requires at least 4 evenly spaced readings a day including days away from work, at least 3 consecutive days work in each work period and at least 3 weeks of record with at least 3 periods away from work, with no changes in treatment, no respiratory infections and usual exposure during the record. The score works by comparing the days off work with the periods at work before and after this (a work-rest-work complex), and the periods at work with the periods off work before and after this (a rest-work-rest complex). The analysis is by pattern recognition and does not require any particular magnitude of change between work and rest days. More (very detailed and possibly a bit complicated) information available on the Oasys score from the
original Oasys paper.
A solid red horizontal line with small circles at each end and another small circle somewhere in the middle indicates that Oasys has detected a possible respiratory tract infection in the record. The circles at each end show the approximate start and end date of the possible infection and the circle in the middle shows the approximate trough of the infection. The infection spotting is done on a four day weighted average before "Pseudo Day Interpretation" so can easily be a few days out compared with what seems obvious to the eye. If possible ask the patient if they had any cold or flu like symptoms during these periods. If so it is best to remove this part of the record (see
adding comments for more details), if not it is a good idea to
add a comment to the record indicating that you have checked.
The background of each day (or pseudo day) can be white (to indicate a day off), coloured and patterned (to indicate a working day - legend for different types of shift shown below) and in a brown grid pattern to indicate that Oasys has no data available for this day. This will never happen if the data is "Pseudo Day Interpreted" as Oasys recommends. Days with a grey background have been excluded from the Oasys analysis. They are still shown on the graph so that you can make a judgement as to whether the exclusion is a good idea.
The x axis for each day shows the day of the week ("Date", M = Monday, T = Tuesday etc), the start date of the pseudo day or day and the end date of the pseudo day or day (usually one day later). Under this the Month and the Year for the date are displayed when necessary. Below this is the number of PEF readings taken ("Readings"), the number of hours worked ("Work Hours" - these are colour coded to the work exposures done that day - see
"Information about the Workplace" in the "Patient Demographics" for details). Below this is the "Additional" section, which contains a "c" if there are comments for the day (these are displayed beneath the graph), "e" if the day has been excluded, "w" if there isn't a reading within 90 minutes of waking for the day and "W" if Oasys has copied a waking reading from a nearby day (this is part of the Pseudo Day Interpretation).
Below the graph is a legend showing all the work exposures for the record. The colours of these match up with the colours of the "Work Hours". To the right of the graph is a legend explaining all the lines and backgrounds on the graph (example below).
Example legend

Example Graph

Comments
Hi!
I need help!
I don't understand why the PEF that I entered don't correspond to the PEF reported on the graph! In fact the daily max and the daily min are lower than they would be there.
Thanks
|
|
Hi. There are two reasons that I can think of. One is that Oasys "Pseudo day interprets" the data by default, so the daily values on the graph don't exactly match up to the ones entered. This is actually a good thing, but is a bit complicated and can be hard to understand. Click on the link below to find out more. The other thing that could be happening is that Oasys is correcting for a problem with older meters (thisi scalled linearisation). This is also turned on by default, but will only have an effect if you have specified that the "Mini-Wright Non Linear" was used. This can be specified in the "Patient Demographics" window. Link also below.
|
|
The "days" on Oasys plots are not callendar days, but start with the first reading at work and continue to the last reading before work on the next day (day interpretation) aas a low reading on waking cannot be due to the work exposures later that day, but the value the following morning can.
|
Please sign in or register to add your thoughts.